Features
Dashboard
Customize your Mingo dashboard with widgets that display collection data as charts and numbers.
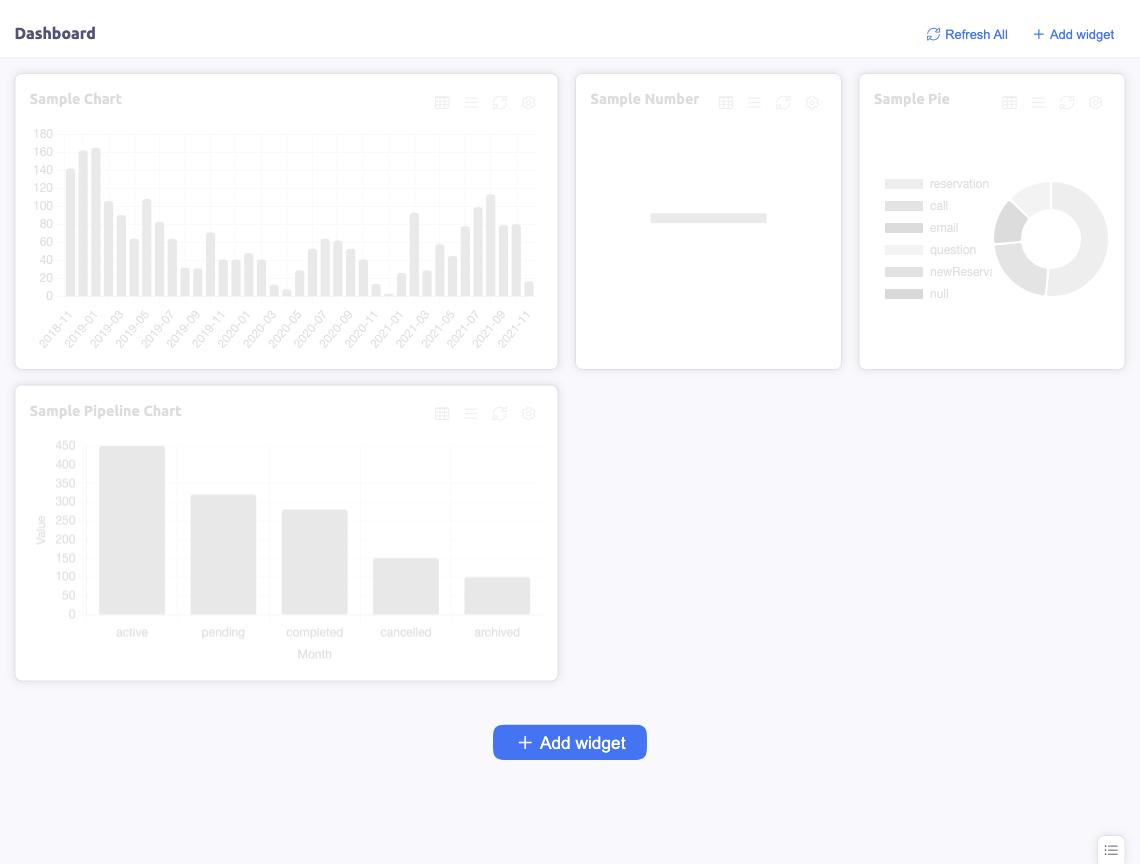
The Dashboard is the first thing you see when opening a connection. It provides a customizable overview of your data through widgets.
Widgets
Add widgets to display data from your collections. Each widget can show:
- Number — a single aggregate value (e.g. total documents, sum of a field)
- Chart — a visual chart of your data
Creating a Widget
Click Add Widget to create a new one:
- Select the database and collection
- Choose the widget type (number or chart)
- Configure the aggregation — what data to display
- Optionally set a query filter to narrow the data
- Give the widget a title
Editing Widgets
Click on a widget to edit its configuration. You can change the data source, type, and display options.
Arranging Widgets
Drag and drop widgets to rearrange them on the dashboard. Resize widgets to give more space to important metrics.
Removing Widgets
Delete widgets you no longer need through the widget's context menu.
Use Cases
- Monitor document counts across key collections
- Track growth metrics over time
- Display key business numbers at a glance
- Create a quick overview of your database health