Server
Server Monitor
Monitor your MongoDB server's health and performance with real-time charts and host information.
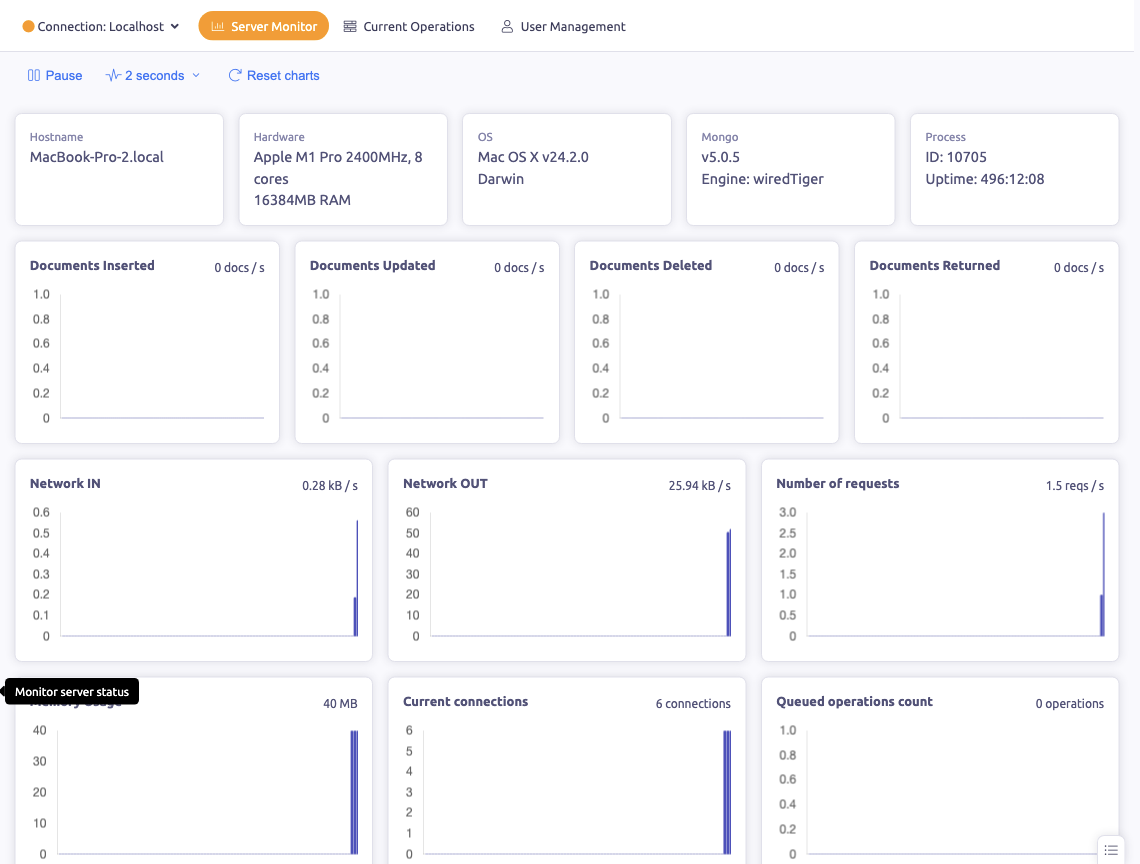
The Server Monitor provides real-time visibility into your MongoDB server's health and performance.
Charts
The monitor displays live auto-scaling charts for key metrics:
- Documents — inserted, updated, deleted, and returned per second
- Operations — operations per second by type
- Network — bytes in/out and request count
- Memory — resident and virtual memory usage
- Connections — current and available connection counts
- Replication — replication lag and status (for replica sets)
Charts auto-refresh to show real-time data. You can pause monitoring to examine a point in time, or reset charts to clear historical data.
Server Information
The monitor shows server details including:
- MongoDB version and storage engine
- Process uptime and PID
- Hostname and port
Hardware Information
- CPU — cores and type
- RAM — total memory
- OS — operating system name, version, and type
Update Frequency
Adjust the polling interval to control how often the charts refresh (1–5+ seconds).